MVC Distance
See the tutorial for a description of Modified Velocity Centroids (MVC).
The distance metric for MVC is based on the t-statistics of the difference between the power spectrum slopes:
\(\beta_i\) and \(\sigma_{\beta_i}\) is the index and index uncertainty, respectively.
More information on the distance metric definitions can be found in Koch et al. 2017.
Using
The data in this tutorial are available here.
We need to import the MVC_Distance class, along with a few other common packages:
>>> from turbustat.statistics import MVC_Distance
>>> from astropy.io import fits
>>> import matplotlib.pyplot as plt
MVC is the only (current) statistic in TurbuStat that requires multiple moment arrays. Because of this, the input for MVC_Distance has a different format than the other distance metrics: a dictionary that contains the array and headers:
>>> moment0 = fits.open("Design4_flatrho_0021_00_radmc_moment0.fits")[0]  # doctest: +SKIP
>>> centroid = fits.open("Design4_flatrho_0021_00_radmc_centroid.fits")[0]  # doctest: +SKIP
>>> lwidth = fits.open("Design4_flatrho_0021_00_radmc_linewidth.fits")[0]  # doctest: +SKIP
>>> data = {"moment0": [moment0.data, moment0.header],
...         "centroid": [centroid.data, centroid.header],
...         "linewidth": [lwidth.data, lwidth.header]}  # doctest: +SKIP
And we create a second dictionary for the data set to compare with:
>>> moment0_fid = fits.open("Fiducial0_flatrho_0021_00_radmc_moment0.fits")[0]  # doctest: +SKIP
>>> centroid_fid = fits.open("Fiducial0_flatrho_0021_00_radmc_centroid.fits")[0]  # doctest: +SKIP
>>> lwidth_fid = fits.open("Fiducial0_flatrho_0021_00_radmc_linewidth.fits")[0]  # doctest: +SKIP
>>> data_fid = {"moment0": [moment0.data, moment0.header],
...             "centroid": [centroid.data, centroid.header],
...             "linewidth": [lwidth.data, lwidth.header]}  # doctest: +SKIP
These dictionaries can optionally include uncertainty arrays for the moments using the same format with keywords moment0_error, centroid_error, and linewidth_error.
These dictionaries get passed to MVC_Distance:
>>> mvc = MVC_Distance(data_fid, data) # doctest: +SKIP
To calculate the distance between the MVC power-spectra is calculated with:
>>> mvc.distance_metric(verbose=True, xunit=u.pix**-1)  # doctest: +SKIP
                            OLS Regression Results
==============================================================================
Dep. Variable:                      y   R-squared:                       0.925
Model:                            OLS   Adj. R-squared:                  0.924
Method:                 Least Squares   F-statistic:                     378.5
Date:                Tue, 13 Nov 2018   Prob (F-statistic):           8.18e-34
Time:                        10:21:40   Log-Likelihood:                -62.343
No. Observations:                  91   AIC:                             128.7
Df Residuals:                      89   BIC:                             133.7
Df Model:                           1
Covariance Type:                  HC3
==============================================================================
                 coef    std err          z      P>|z|      [0.025      0.975]
------------------------------------------------------------------------------
const         15.2461      0.161     94.965      0.000      14.931      15.561
x1            -4.8788      0.251    -19.455      0.000      -5.370      -4.387
==============================================================================
Omnibus:                        5.193   Durbin-Watson:                   0.068
Prob(Omnibus):                  0.075   Jarque-Bera (JB):                4.522
Skew:                          -0.459   Prob(JB):                        0.104
Kurtosis:                       2.408   Cond. No.                         4.40
==============================================================================
                            OLS Regression Results
==============================================================================
Dep. Variable:                      y   R-squared:                       0.941
Model:                            OLS   Adj. R-squared:                  0.941
Method:                 Least Squares   F-statistic:                     477.5
Date:                Tue, 13 Nov 2018   Prob (F-statistic):           1.55e-37
Time:                        10:21:40   Log-Likelihood:                -52.867
No. Observations:                  91   AIC:                             109.7
Df Residuals:                      89   BIC:                             114.8
Df Model:                           1
Covariance Type:                  HC3
==============================================================================
                 coef    std err          z      P>|z|      [0.025      0.975]
------------------------------------------------------------------------------
const         14.0302      0.144     97.714      0.000      13.749      14.312
x1            -5.0144      0.229    -21.853      0.000      -5.464      -4.565
==============================================================================
Omnibus:                        3.541   Durbin-Watson:                   0.129
Prob(Omnibus):                  0.170   Jarque-Bera (JB):                3.488
Skew:                          -0.469   Prob(JB):                        0.175
Kurtosis:                       2.800   Cond. No.                         4.40
==============================================================================
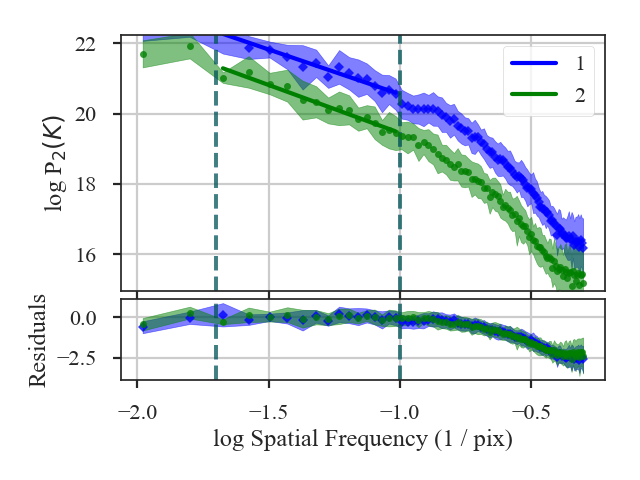
The MVC spectra are plotted in the figure and the fit summaries are printed out. The distance between the indices is:
>>> mvc.distance  # doctest: +SKIP
0.3988169606167437
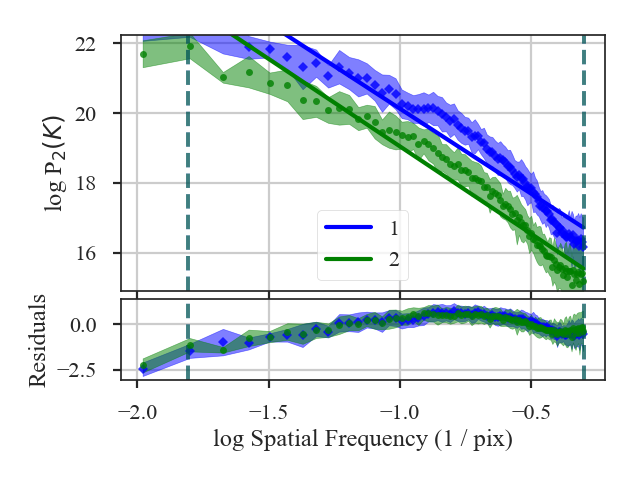
This is an awful fit. We want to limit where the spectra are fit. Keywords for MVC can be passed with low_cut, high_cut, breaks, pspec_kwargs and pspec2_kwargs. If separate parameters need to be set, a two-element list or array can be given to low_cut, high_cut and breaks; the second element will be used for the second data set. For example, limiting the fit region can be done with:
>>> mvc = MVC_Distance(data_fid, data, low_cut=0.02 / u.pix,
...                    high_cut=0.4 / u.pix)  # doctest: +SKIP
>>> mvc.distance_metric(verbose=True, xunit=u.pix**-1)  # doctest: +SKIP
                            OLS Regression Results
==============================================================================
Dep. Variable:                      y   R-squared:                       0.946
Model:                            OLS   Adj. R-squared:                  0.942
Method:                 Least Squares   F-statistic:                     135.6
Date:                Tue, 13 Nov 2018   Prob (F-statistic):           2.99e-08
Time:                        10:36:41   Log-Likelihood:                 10.700
No. Observations:                  15   AIC:                            -17.40
Df Residuals:                      13   BIC:                            -15.98
Df Model:                           1
Covariance Type:                  HC3
==============================================================================
                 coef    std err          z      P>|z|      [0.025      0.975]
------------------------------------------------------------------------------
const         17.9988      0.266     67.588      0.000      17.477      18.521
x1            -2.5502      0.219    -11.647      0.000      -2.979      -2.121
==============================================================================
Omnibus:                        1.189   Durbin-Watson:                   2.376
Prob(Omnibus):                  0.552   Jarque-Bera (JB):                0.814
Skew:                          -0.200   Prob(JB):                        0.666
Kurtosis:                       1.931   Cond. No.                         13.5
==============================================================================
                            OLS Regression Results
==============================================================================
Dep. Variable:                      y   R-squared:                       0.951
Model:                            OLS   Adj. R-squared:                  0.948
Method:                 Least Squares   F-statistic:                     70.08
Date:                Tue, 13 Nov 2018   Prob (F-statistic):           1.36e-06
Time:                        10:36:41   Log-Likelihood:                 10.420
No. Observations:                  15   AIC:                            -16.84
Df Residuals:                      13   BIC:                            -15.42
Df Model:                           1
Covariance Type:                  HC3
==============================================================================
                 coef    std err          z      P>|z|      [0.025      0.975]
------------------------------------------------------------------------------
const         16.7135      0.390     42.879      0.000      15.950      17.477
x1            -2.7335      0.327     -8.371      0.000      -3.373      -2.094
==============================================================================
Omnibus:                        0.831   Durbin-Watson:                   2.076
Prob(Omnibus):                  0.660   Jarque-Bera (JB):                0.621
Skew:                          -0.449   Prob(JB):                        0.733
Kurtosis:                       2.568   Cond. No.                         13.5
==============================================================================
The distance is now:
>>> mvc.distance  # doctest: +SKIP
0.46621655722371613
A pre-computed MVC class can also be passed instead of giving a dataset as the input. See the distance metric introduction.